I wrote a program that maximizes the folding energy of RNA. It took a RNA sequence and performed random synonymous changes on it. After each mutation the sequence was folded using Unafold and if the new folding energy was greater than the previous folding energy then the k-mer frequency score was calculated and the results recorded. The k-mer frequency score was calculated by taking the RNA sequence and its reverse compliment and finding substrings of length k. These k-mers were then placed in a hash that also recorded how often the k-mers appeared in each sequence. Then the hashes were compared to see which k-mers appeared in both. If a k-mer was present in both hashes then its frequency from the first hash and its frequency from the second hash were multiplied and added to the final k-mer score.
This graph shows how the folding energy and the k-mer frequency over the course of 350 accepted mutations. The red line is the k-mer frequency score and the blue line is the folding energy. The x-axis is the number of accepted mutations and the y-axis is the numerical value for each line. This graph was run when folding energies of greater than or equal to values were accepted.
This graph shows how the folding energy and the k-mer frequency over the course of 350 accepted mutations. The red line is the k-mer frequency score and the blue line is the folding energy. The x-axis is the number of accepted mutations and the y-axis is the numerical value for each line. This graph was run when folding energies of greater than or equal to values were accepted.
This next graph shows similar data but was taken when only folding energies that were greater than the previous one were accepted. This program was left to run for about 2 days and produced minimal results which is why the graph above was included.
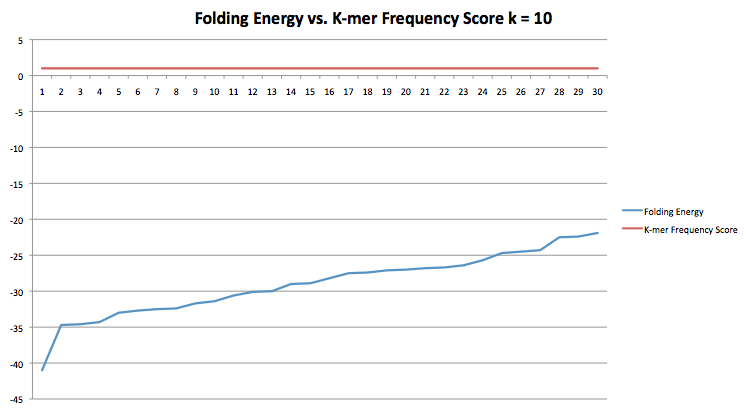
This next graph is like the same as the previous but k=10 instead of k=5.
All runs of the program were done using the same RNA sequence. After the program was done running the new sequence was compared with the old one to ensure it coded to the same protein.
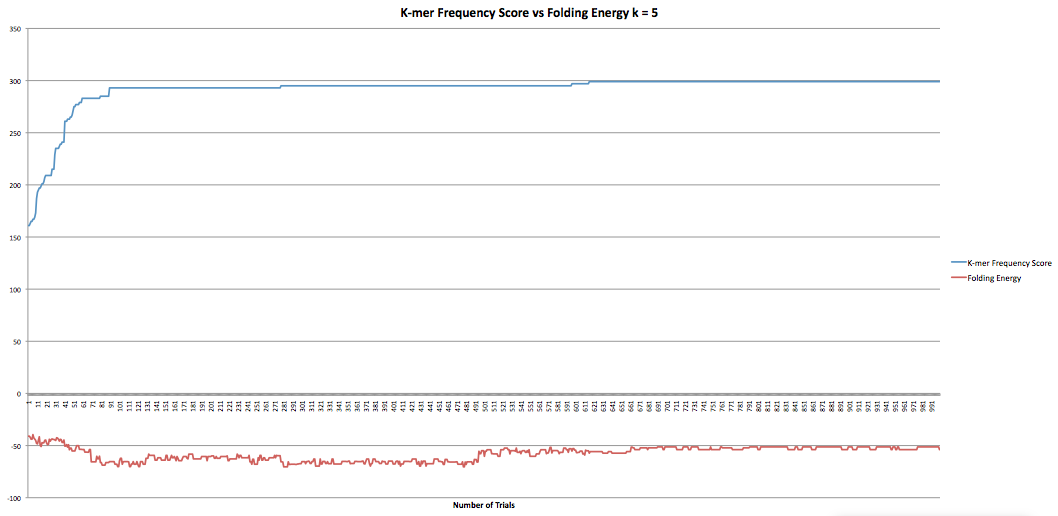
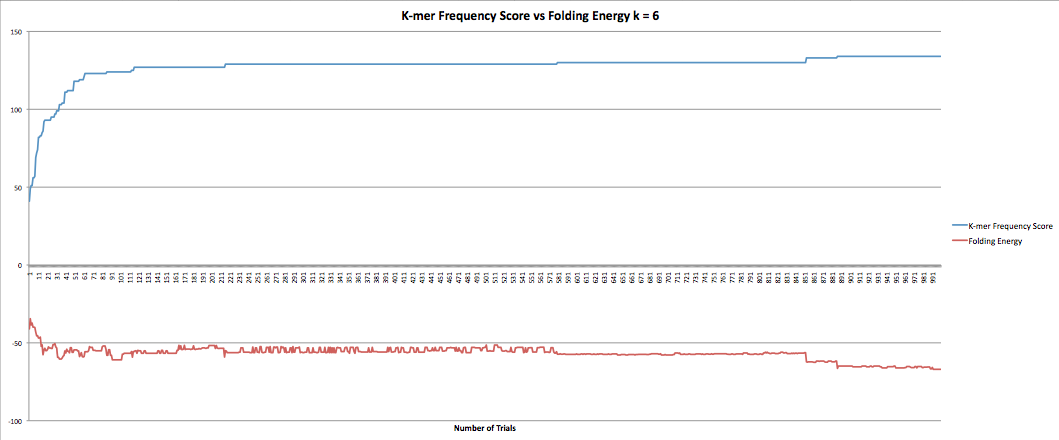
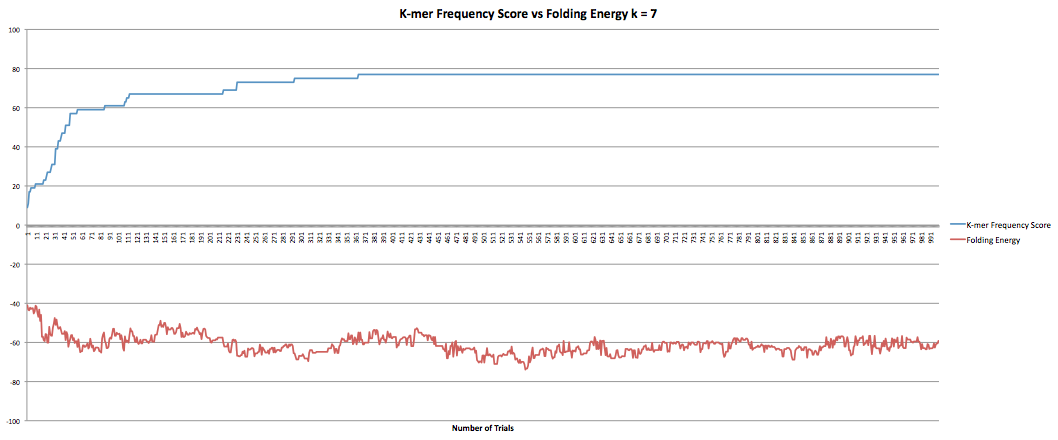
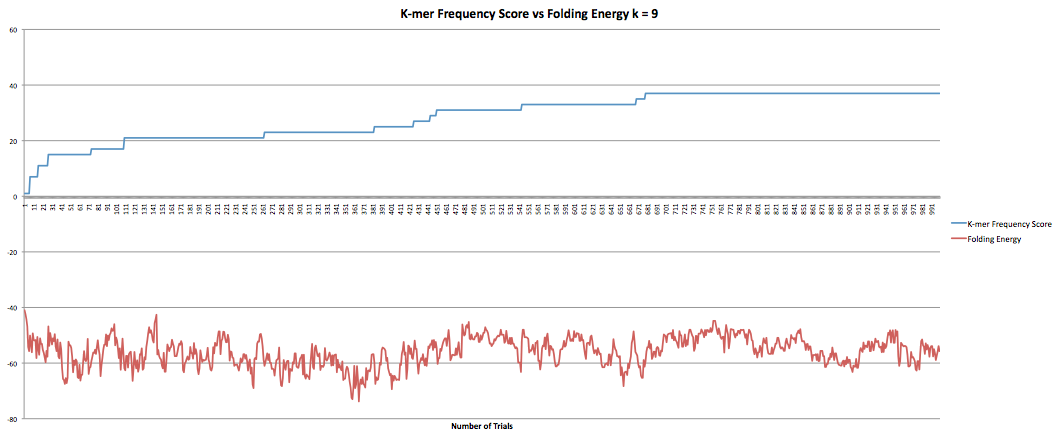
The next part I was working on was the program that maximized the k-mer frequency score. This program calculates the k-mer frequency score the same way the other program does. Additionally, it had a "k-mer breaker" that added extra mutations at the k-mer level when the RNA sequence became stuck at a k-mer score. This helped improve the speed at which the program could produce results although only marginally as it still took hours to get through it. However, when the new sequences were compared to the original sequence it was found that they now longer coded to the same protein. I took the k-mer breaker out which seemed to fix the problem but decreased the speed of the program. I did have some data I collected earlier in the semester where the program ran for 1000 trials and accepted k-mer frequency scores of greater than or equal value. I also had the fasta files they produced so I was able to confirm that they coded to the same protein. The graphs below show the results for k-lengths for 5 through 10. The blue lines are the k-mer frequency score. The red lines are the folding energy. The x-axis refers to the number of trials.
The next part I was working on was the program that maximized the k-mer frequency score. This program calculates the k-mer frequency score the same way the other program does. Additionally, it had a "k-mer breaker" that added extra mutations at the k-mer level when the RNA sequence became stuck at a k-mer score. This helped improve the speed at which the program could produce results although only marginally as it still took hours to get through it. However, when the new sequences were compared to the original sequence it was found that they now longer coded to the same protein. I took the k-mer breaker out which seemed to fix the problem but decreased the speed of the program. I did have some data I collected earlier in the semester where the program ran for 1000 trials and accepted k-mer frequency scores of greater than or equal value. I also had the fasta files they produced so I was able to confirm that they coded to the same protein. The graphs below show the results for k-lengths for 5 through 10. The blue lines are the k-mer frequency score. The red lines are the folding energy. The x-axis refers to the number of trials.